Hi! My name is Moses Owhonda. I am currently studying for a Masters degree in Data Science from the University of South Wales. I completed the Udacity Data Analytics Nanodegree, SQL for Data Analysis, and Coursera Machine Learning Specialization programs.
Working in the energy industry helped to stimulate my analytical and troubleshooting mindset, but from a young age, I have always enjoyed the thrill of solving puzzles. This is exactly how I look at raw data; one more big puzzle to solve, for which I get a rush of dopamine and a sense of achievement.
Drawing actionable insights from data is something I'm passionate about, and predictive modelling, data analysis and visualizations are some of the techniques that I exploit to achieve this.
Projects

In this project, we analyzed the Wisconsin Breast Cancer dataset to classify breast masses as benign or malignant based on multiple features extracted from fine needle aspirate (FNA) images.
Various imputation techniques were used to handle missing values, after which unsupervised and supervised machine learning models were used to extract insights and classify the tumor.

In this project, we delved into a comprehensive analysis of Amazon book reviews utilizing various analytical techniques in R.
Our exploration aimed to extract meaningful insights into reader sentiments, preferences, and trends hidden within the reviews through text mining, sentiment analysis, topic modeling, and exploratory data analysis.
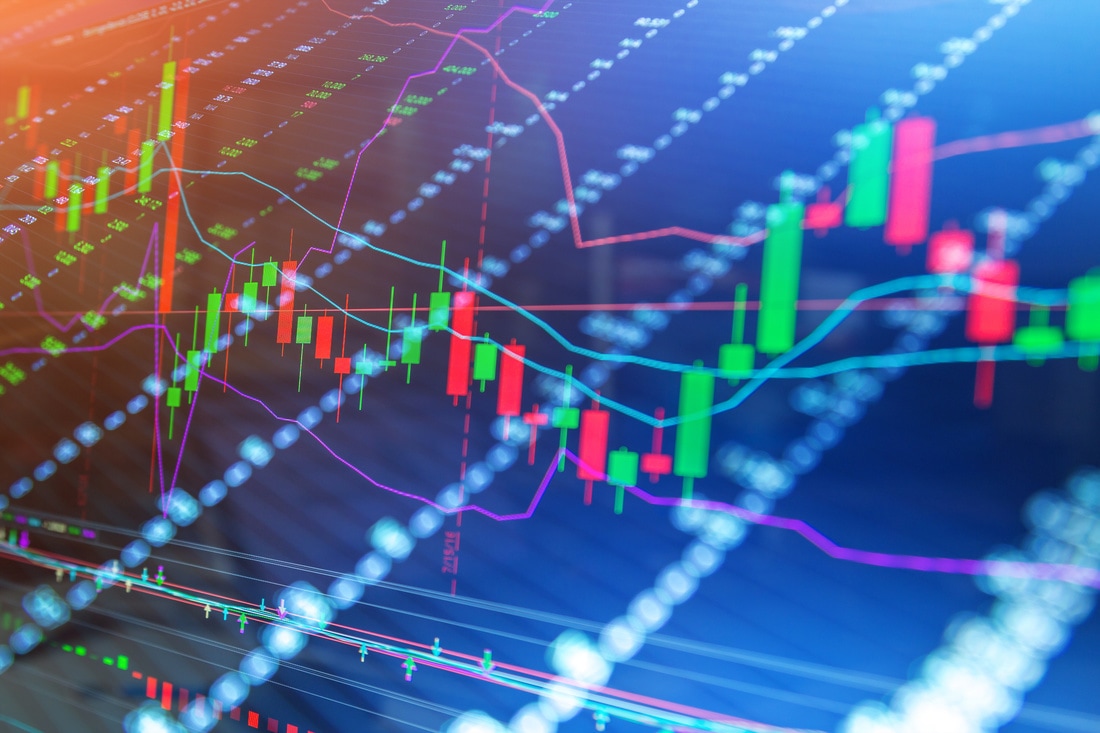
In this project, we use the selenium library in Python to scrape daily forex data of the major currency pairs, as well as some cross currency pairs from January 1st, 2019 to September 30th, 2022.
We then carry out an analysis of the data, visualizing with interactive candle charts to detect trends and price movement for the period highlighted.
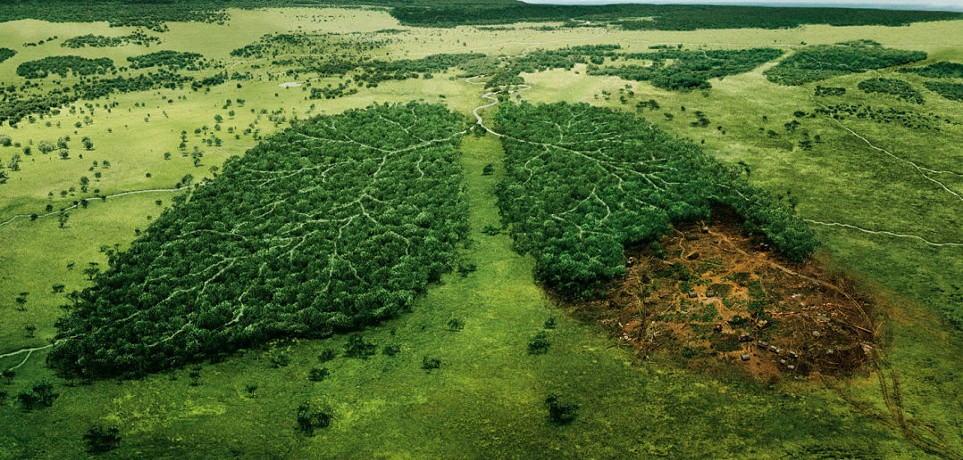
Data analysis in PostgreSQL of Global Deforestation data from 1990 to 2016, as obtained from the World Bank.

For this project, we utilize several Python libraries to query Twitter API and extract JSON data of archived tweets from WeRateDogs.
We then combine the data for analysis and create visualizations.

Exploratory analysis of 113,937 loans from American loan finance platform, Prosper Loans. After exploration, we create a slide deck to visualize the characteristics of different loan features.
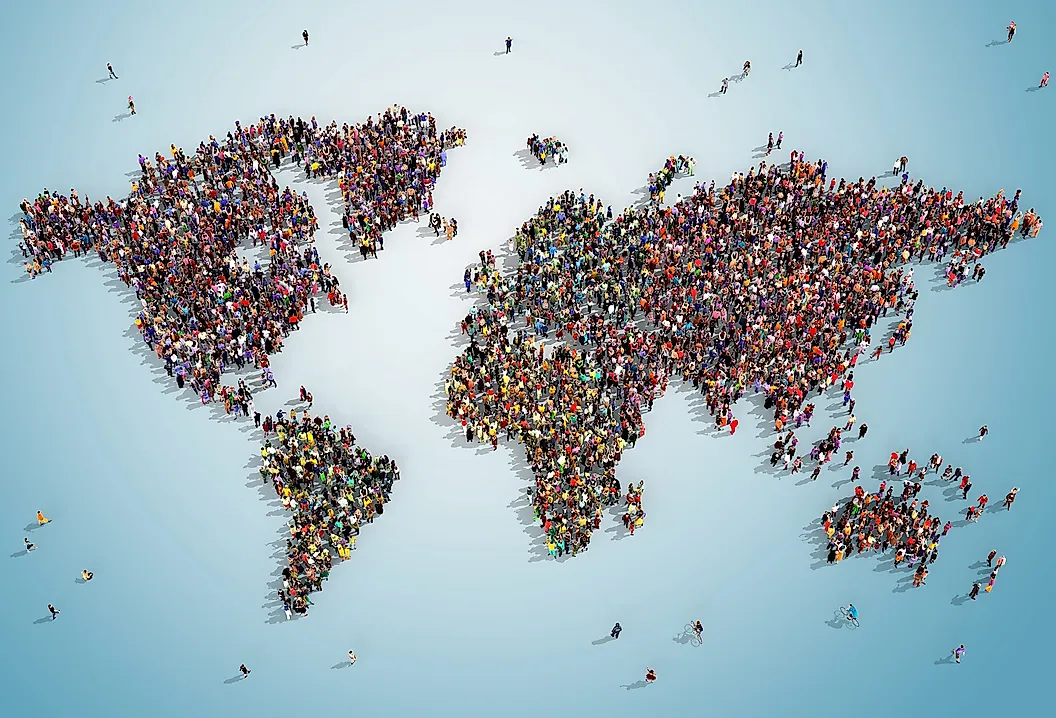
In this project, we use Python to clean data obtained from the United Nations, containing annual estimates of the World's population from 1950 to 2022,
as well as medium projections of the World population upto the year 2100. After cleaning in Python, we use Tableau to build dashboards to visualize the data.
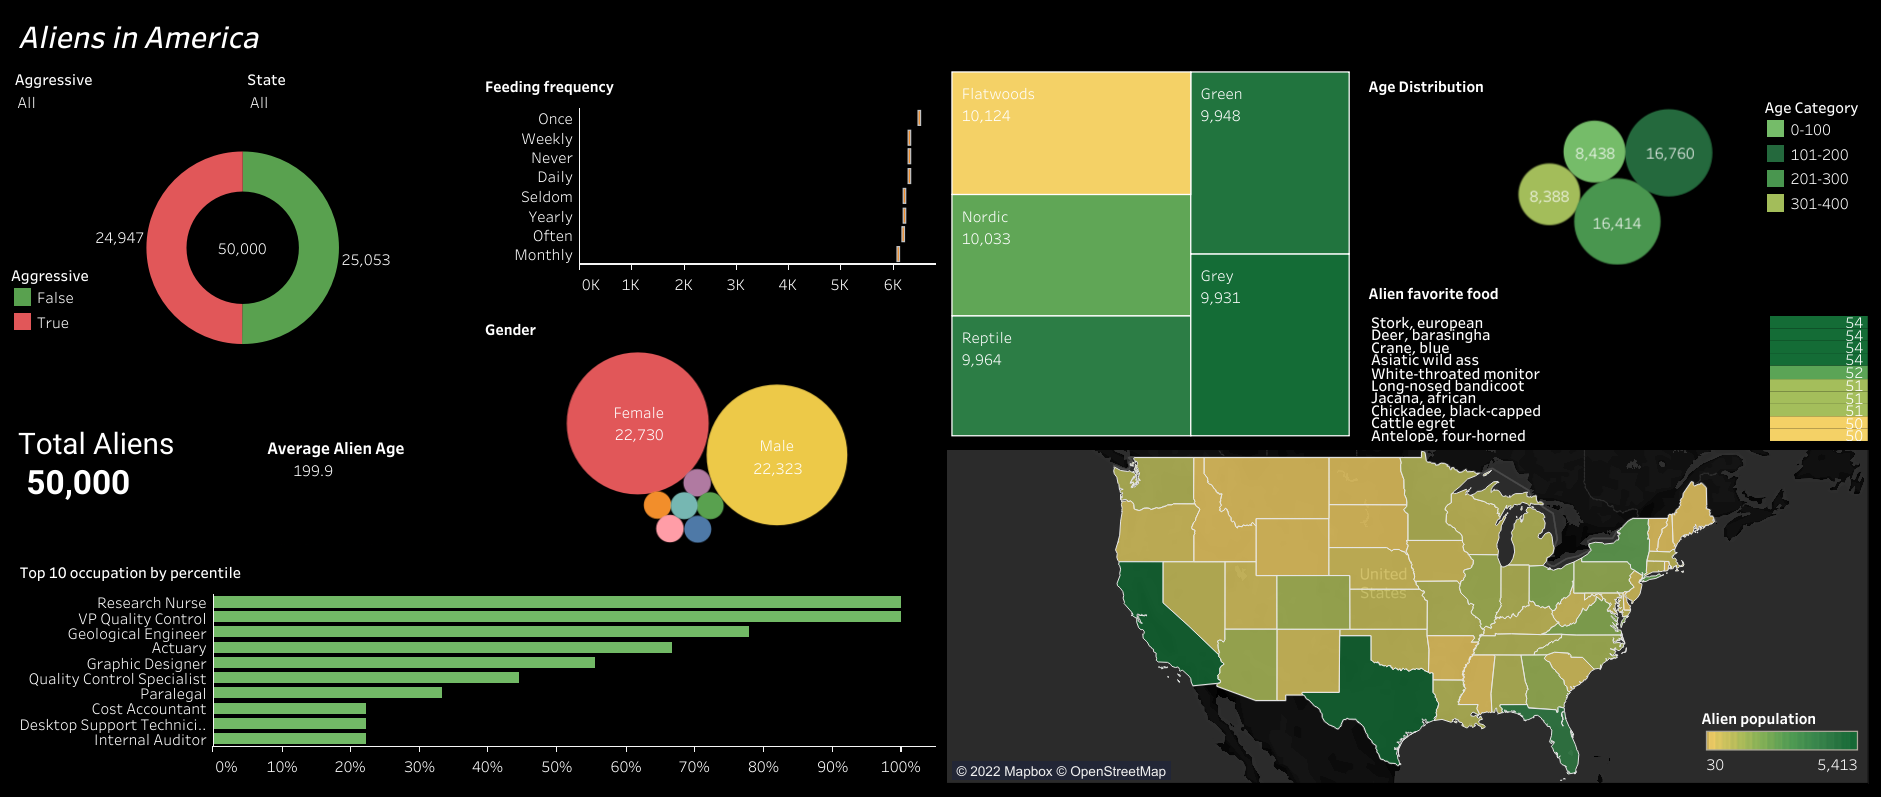
Using Tableau, we build an interactive dashboard to visualize Aliens in America dataset for a pharmaceutical company looking to market new treatment, by determining the diet, age, and aggressiveness of the aliens.
Get In Touch
Feel free to check out all my repositories and provide constructive feedback as this would help me to improve on my work.